Two Graphs Masterclass
The most complex Task 1 type — master the art of synthesising two different data sources into one coherent, analytical response.
What Is a Two Graphs / Mixed Charts Question?
A Two-Graph (Mixed Chart) task presents two different types of visual data — often a bar chart and a table, or a chart and a graph. The key challenge is that you must integrate both sources rather than describe them separately. Examiners specifically assess whether you can draw connections between the two charts and identify the relationships that emerge when you look at both together.
Study the prompt carefully before writing. Identify the key variables, time periods, and units.
Plan First — Always
⏱ Use the First 2–3 Minutes to Plan
Before typing a single word of your essay, spend 2–3 minutes identifying: the main trend(s), any notable exceptions or comparisons, and how you will group your detail paragraphs. Students who plan first consistently write more cohesive, Band 7+ responses. Jumping straight into writing is one of the most common mistakes test-takers make.
📋 The 4 Official Marking Criteria — Equal Weighting
Every Task 1 answer is marked on exactly four criteria, each worth 25% of your Task 1 score:
1. Task Achievement — Did you address the task? Is there a clear overview? Did you select and highlight key features?
2. Coherence and Cohesion — Is the essay logically organised? Does it progress clearly? Are cohesive devices used appropriately, without over-use?
3. Lexical Resource — Is vocabulary varied and precise? Are less common words used appropriately?
4. Grammatical Range and Accuracy — Are a variety of structures used? Are sentences mostly error-free?
The overview directly impacts Criterion 1. Vocabulary variety directly impacts Criterion 3. Sentence variety impacts Criterion 4. All four are equally important.
The 4-Paragraph Formula
Why Always 4 Paragraphs?
A clear 4-paragraph structure instantly signals to the examiner that you are organised and aware of what Task 1 requires. It separates general from specific, ensures you never mix raw data into your overview, and makes your essay easy to read and mark. Stick to this every single time.
1 Paragraph 1 — Introduction INTRO
Paraphrase both components clearly. The bar chart and the table must both be referenced in the introduction. Restructure the sentence to show you understand both sources of data.
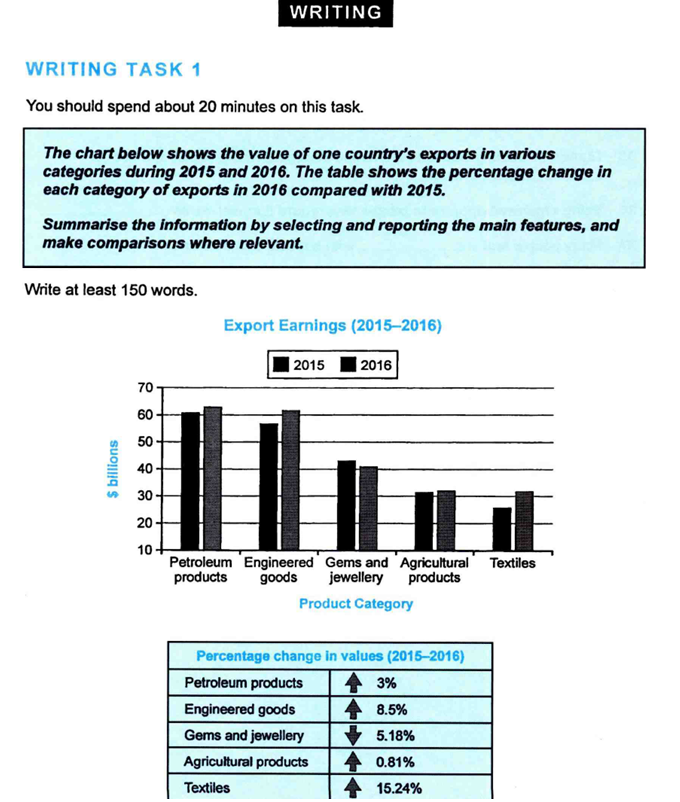
Paraphrase: The bar chart compares the monetary value of a country's exports across five different sectors over a two-year period, while the accompanying table outlines the percentage variation in each category in 2016 relative to 2015.
2 Paragraph 2 — Overview OVERVIEW ★
The Overview — Leaders, Exceptions, and the General Direction
Start with Overall,. Identify: which sectors dominated by value, which was the only declining sector, and the general upward direction of most categories. No figures.
3 Paragraph 3 — Detail Group 1 DETAILS
Describe petroleum and engineered goods — the top two earners — together. For each, give the approximate bar chart figures and integrate the percentage change from the table. Highlight that they nearly converged by 2016.
4 Paragraph 4 — Detail Group 2 DETAILS
Cover the remaining three sectors: gems (the only decline), agricultural (smallest growth), and textiles (highest growth rate despite lowest starting value). The contrast between textiles' low value but high growth rate is the key analytical observation here.
How to Build Your Sentences
Mix All Three Types Naturally
IELTS examiners reward grammatical range. The key word is natural. Only use linking words and complex structures when they genuinely improve clarity, never just to sound academic.
Cross-Referencing Between Charts
The key skill in a two-graph task is connecting the two visuals. Use language that explicitly links data from the bar chart to data from the table.
Compound Sentence — Two-Year Comparison
Complex Sentence — Contrast Between Value and Growth Rate
One of the most analytical observations in this task is that high-value categories do not necessarily have high growth rates.
Contrasting the Only Decline
When one category bucks the general trend, use strong contrast language to highlight it.
Strategies Specific to This Question Type
🔗 Two Charts = One Coherent Story
The most important skill in a two-graph task is synthesising — connecting the information from both visuals rather than describing them completely separately. The bar chart shows absolute values; the table shows percentage changes. Together, they tell a richer story.
The Central Insight in This Task:
The highest-earning sector (petroleum) is NOT the fastest-growing (textiles). The lowest-earning sector (textiles) is the fastest grower. The only sector to decline (gems) is a mid-range earner. These contrasts are what make the response analytical.
📊 How to Structure Your Two Detail Paragraphs
Option 1 — By Chart: Describe bar chart data in paragraph 3, percentage change data in paragraph 4. Clean but risks missing connections.
Option 2 — By Theme (Recommended): Describe the top earners with their growth rates together in paragraph 3, and the lower earners + the exception in paragraph 4. This integrates both charts naturally.
🎯 The Exception Rule
Gems and jewellery is the ONLY sector that declined. In any Task 1 task, the exception to the general trend always deserves explicit mention. Flag it clearly: "the only sector to register a negative change", "the sole category to decline", "uniquely".
Pro Tips That Separate Band 7 from Band 6
Proofread After Each Sentence
Don't wait until the end to proofread. Read each sentence immediately after writing it. If you spot errors at the end with only 30 seconds left, you will panic and that leads to more mistakes. Sentence-by-sentence proofreading keeps you calm and accurate.
Keep Your Overview Data-Free
The overview covers main trends, differences or stages. Never include specific numbers, percentages, or dates here. Save all raw data for your detail paragraphs. This is the single most common mistake that costs students marks on Task Achievement.
Group Details Logically
Don't just describe each category one by one. Group the highest with the lowest to show contrast, OR the highest with the second-highest if they're close together. Logical grouping shows analytical thinking, which is exactly what examiners reward.
Paraphrase — Don't Copy
Your introduction must paraphrase the task prompt using strong synonyms where appropriate. But don't force synonyms — only replace words when a genuinely better alternative exists. Forced vocabulary sounds unnatural and lowers your Lexical Resource score.
Do Not Over-Use Linking Words
The official IELTS criteria explicitly penalises both under-use and over-use of cohesive devices. Do not start every sentence with "Furthermore", "Moreover" or "In addition". Use linking words only when they add logical meaning. Two or three well-placed connectors per paragraph is enough. Forcing them into every sentence reads as mechanical, not fluent.
Aim for 175–200 Words
The official minimum is 150 words. Going under directly reduces your Task Achievement score. The sweet spot is 170–190 words. Going much over 200 wastes your 20 minutes and risks introducing errors. Every sentence must add genuine information value. Padding to reach a word count is penalised under Task Achievement.
Integrate, Don't Separate
Many students describe the bar chart entirely in paragraph 3 and the table entirely in paragraph 4. This misses the point. Integrate the data: when you mention a category's value, immediately add its percentage change. This synthesis is exactly what earns you marks for Coherence and Cohesion.
Full Model Answer — Annotated
Model Answer with Paragraph Labels
The bar chart compares the monetary value of a country's exports across five different sectors over a two-year period, while the accompanying table outlines the percentage variation in each category in the second year relative to the first.
Overall, petroleum products and engineered goods generated the highest export revenues in both years, whereas textiles and agricultural products were the least valuable categories. Most sectors experienced growth, with textiles recording the largest increase, while gems and jewellery was the only category to decline.
Petroleum products represented the leading export, rising slightly from about $60 billion to just over $62 billion. Engineered goods ranked second, increasing from approximately $58 billion to around $62 billion, nearly matching petroleum by the end of the period. In contrast, gems and jewellery earned roughly $43 billion initially but fell modestly to about $41 billion.
In terms of growth rates, textiles experienced the most dramatic expansion at 15.24%, despite being the smallest earner at roughly $26 billion at the start. Engineered goods also recorded a strong increase of 8.5%, while petroleum grew more moderately at 3%. Agricultural products saw only marginal growth of 0.81%. By contrast, gems and jewellery declined by 5.18%, making it the sole sector to register a negative change.
✅ What Makes This a Band 7+ Response?
Notice how the introduction paraphrases without copying. The overview clearly states main trends or differences without any raw data, which is the key Band 7 Task Achievement requirement. The detail paragraphs group information logically with clear progression throughout, satisfying the Coherence and Cohesion criterion. The language moves naturally between simple, compound and complex sentences without over-using linking words, and vocabulary is varied without being forced.
Ready to Master the Hardest Task 1 Type? Get Expert Feedback Now.
Get personalised feedback on your Task 1 essays from Ed — an IELTS expert who has helped hundreds of students reach Band 7 and above. Your band score is not fixed. Let's raise it together.
Start Your Journey at IELTSbyEd.com →Join hundreds of students who improved their band score with IELTSbyEd
