Pie Chart Masterclass
Master the art of describing proportions, fractions, and comparisons across multiple pie charts — without simply listing every number.
What Is a Pie Chart Question?
A Pie Chart question presents one or more circular diagrams divided into segments, each representing a proportion of a whole, usually expressed as a percentage. Your job is NOT to list every number. It is to identify the most significant proportions, compare them meaningfully, and highlight any striking differences or similarities across charts.
Study the prompt carefully before writing. Identify the key variables, time periods, and units.
Plan First — Always
⏱ Use the First 2–3 Minutes to Plan
Before typing a single word of your essay, spend 2–3 minutes identifying: the main trend(s), any notable exceptions or comparisons, and how you will group your detail paragraphs. Students who plan first consistently write more cohesive, Band 7+ responses. Jumping straight into writing is one of the most common mistakes test-takers make.
📋 The 4 Official Marking Criteria — Equal Weighting
Every Task 1 answer is marked on exactly four criteria, each worth 25% of your Task 1 score:
1. Task Achievement — Did you address the task? Is there a clear overview? Did you select and highlight key features?
2. Coherence and Cohesion — Is the essay logically organised? Does it progress clearly? Are cohesive devices used appropriately, without over-use?
3. Lexical Resource — Is vocabulary varied and precise? Are less common words used appropriately?
4. Grammatical Range and Accuracy — Are a variety of structures used? Are sentences mostly error-free?
The overview directly impacts Criterion 1. Vocabulary variety directly impacts Criterion 3. Sentence variety impacts Criterion 4. All four are equally important.
The 4-Paragraph Formula
Why Always 4 Paragraphs?
A clear 4-paragraph structure instantly signals to the examiner that you are organised and aware of what Task 1 requires. It separates general from specific, ensures you never mix raw data into your overview, and makes your essay easy to read and mark. Stick to this every single time.
1 Paragraph 1 — Introduction INTRO
Paraphrase the task statement. Replace key nouns with synonyms where appropriate: "charts" → "pie charts" / "diagrams", "show" → "illustrate" / "present", "average percentages" → "mean proportions". You may also restructure the sentence order. Do not force synonyms where none fit naturally.
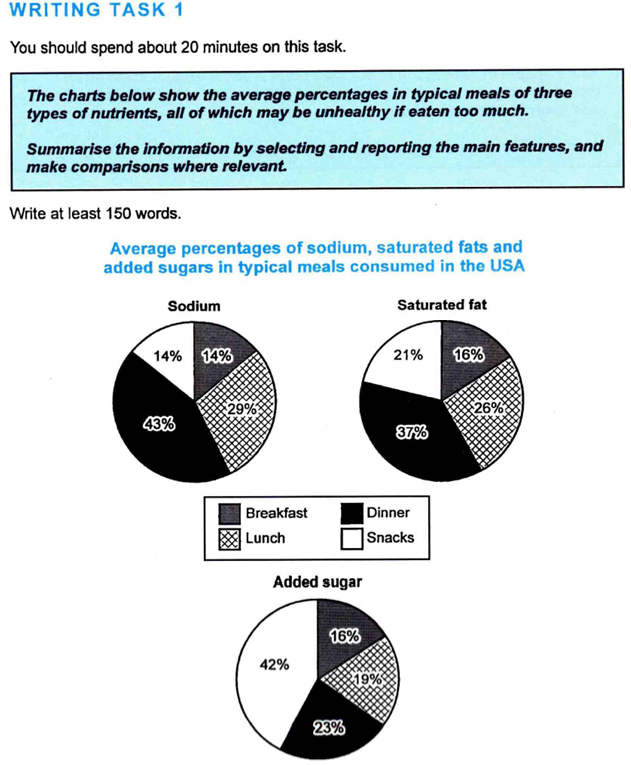
Paraphrase: The three pie charts illustrate the mean proportions of sodium, saturated fat and added sugar contained in four typical daily meals in the United States, all of which can be detrimental to health when consumed excessively.
2 Paragraph 2 — Overview OVERVIEW ★
Paragraph 2 — The Overview (No data allowed!)
Start with Overall, and state 2–4 general trends or main differences. This is what the official IELTS Band 7 descriptor explicitly requires. For this task: which meal type is consistently highest? Which is consistently lowest? Is there any striking contrast between the three nutrients? You must identify what makes the added sugar chart different from the other two.
3 Paragraph 3 — Detail Group 1 DETAILS
Group the two charts that share a similar pattern — sodium and saturated fat, both peaking at dinner. The key here is varying how you express proportions across the paragraph: sometimes lead with the fraction, sometimes with the raw figure, sometimes use approximation language mid-sentence. Never repeat the same structure twice in a row.
4 Paragraph 4 — Detail Group 2 DETAILS
Open with contrast language and describe the added sugar chart, which breaks the dinner-dominant pattern entirely. Vary your expressions: use fractions in some places, raw figures in others, and approximation language where a number sits close to a round value. No two sentences should describe data the same way.
How to Build Your Sentences
Mix All Three Types Naturally
IELTS examiners reward grammatical range. The key word is natural. Only use linking words and complex structures when they genuinely improve clarity, never just to sound academic.
Simple Sentence
One subject + one verb + one idea. Use these to state clear facts about your largest or smallest segments.
Compound Sentence
Two independent clauses joined by a coordinating conjunction. Use to connect two related data points naturally.
Complex Sentence
A main clause + relative clause. Use when comparing or contrasting two charts in the same sentence.
🔢 Fractions vs Percentages — Your Conversion Table
Never just quote the percentage. Convert to a fraction first, then add the percentage in brackets. This is what separates a mechanical answer from a Band 7+ one. Use just above / just under / approximately / around / at about to be precise without being robotic.
~43% → just under half (43%)
~42% → just under half / just over two-fifths (42%)
~37% → just over a third (37%)
~33% → approximately one third / around a third
~29% → just under a third (29%)
~26% → just over a quarter (26%)
~25% → approximately a quarter / around one quarter
~23% → just under a quarter (23%)
~21% → approximately one fifth (21%)
~19% → approximately one fifth / just under one fifth (19%)
~16% → approximately one sixth (16%)
~14% → approximately one seventh / just under one seventh (14%)
Strategies Specific to This Question Type
🔢 Vary How You Express Every Data Point
The examiner is watching for repetition. If every sentence follows the same pattern, such as "X accounts for [fraction] at Y%", your Lexical Resource score suffers even if the fractions are correct. Instead, rotate across these structures so no two sentences sound alike:
✅ "the figure for lunch, 29%, represents just under a third"
✅ "snacks, at 42%, contributed roughly two-fifths of the total"
✅ "breakfast recorded the lowest share, at approximately one sixth (16%)"
✅ "the 26% figure for lunch amounts to just over a quarter"
The data stays the same. The expression changes every time. That is what lexical variety looks like in practice.
📊 Comparing Across Multiple Charts
When you have more than one pie chart (like this task), compare patterns across charts rather than describing each pie separately. Ask yourself: which meals are consistently high or low across all three nutrients?
🎯 Group Your Two Detail Paragraphs Logically
With three pie charts, group the two that share a similar pattern together (sodium and saturated fat both peak at dinner), and write the contrasting chart (added sugar) in a separate paragraph. This shows analytical thinking.
Pro Tips That Separate Band 7 from Band 6
Proofread After Each Sentence
Don't wait until the end to proofread. Read each sentence immediately after writing it. If you spot errors at the end with only 30 seconds left, you will panic and that leads to more mistakes. Sentence-by-sentence proofreading keeps you calm and accurate.
Keep Your Overview Data-Free
The overview covers main trends, differences or stages. Never include specific numbers, percentages, or dates here. Save all raw data for your detail paragraphs. This is the single most common mistake that costs students marks on Task Achievement.
Group Details Logically
Don't just describe each category one by one. Group the highest with the lowest to show contrast, OR the highest with the second-highest if they're close together. Logical grouping shows analytical thinking, which is exactly what examiners reward.
Paraphrase — Don't Copy
Your introduction must paraphrase the task prompt using strong synonyms where appropriate. But don't force synonyms — only replace words when a genuinely better alternative exists. Forced vocabulary sounds unnatural and lowers your Lexical Resource score.
Do Not Over-Use Linking Words
The official IELTS criteria explicitly penalises both under-use and over-use of cohesive devices. Do not start every sentence with "Furthermore", "Moreover" or "In addition". Use linking words only when they add logical meaning. Two or three well-placed connectors per paragraph is enough. Forcing them into every sentence reads as mechanical, not fluent.
Aim for 175–200 Words
The official minimum is 150 words. Going under directly reduces your Task Achievement score. The sweet spot is 170–190 words. Going much over 200 wastes your 20 minutes and risks introducing errors. Every sentence must add genuine information value. Padding to reach a word count is penalised under Task Achievement.
Use Approximation Language — Always
Saying "approximately 60 billion" or "at about 50%" is not a weakness — it is a sign of academic writing maturity. Use: just above, just under, approximately, around, at about, roughly, nearly, close to. Reserve exact figures only for the clearest data points. Approximating correctly is actively rewarded by IELTS examiners under Lexical Resource.
You Don't Need to Report Everything
With pie charts, only select the most striking data points: highest, lowest, any surprising contrast. Listing all percentages wastes words and reads like a data dump, not an academic summary.
Full Model Answer — Annotated
Model Answer with Paragraph Labels
The three pie charts illustrate the mean proportions of sodium, saturated fat and added sugar contained in four typical daily meals in the United States, namely breakfast, lunch, dinner and snacks, all of which can be detrimental to health when consumed excessively.
Overall, dinner accounts for the highest shares of sodium and saturated fat intake, whereas added sugar is consumed predominantly in snacks. In contrast, breakfast consistently contributes the smallest proportion across all three nutrients.
For sodium, dinner accounts for the largest share, just under half, followed by 29% for lunch. Breakfast and snacks each contributed a relatively small 14%. A similar distribution is evident in saturated fat, where dinner again dominates at roughly a third, while lunch amounts to just over a quarter. Snacks contributed around a fifth, and breakfast recorded the smallest share at 16%.
In contrast, the distribution of added sugar follows a markedly different pattern. Snacks account for 42%, roughly double the dinner figure, where just under a quarter was recorded. Lunch contributed just under a fifth, while breakfast, at 16%, again represented the smallest portion across all three nutrients. Unlike sodium and saturated fat, which are concentrated at mealtimes, sugar intake is clearly driven by snacking.
✅ What Makes This a Band 7+ Response?
Notice how the introduction paraphrases without copying. The overview clearly states main trends or differences without any raw data, which is the key Band 7 Task Achievement requirement. The detail paragraphs group information logically with clear progression throughout, satisfying the Coherence and Cohesion criterion. The language moves naturally between simple, compound and complex sentences without over-using linking words, and vocabulary is varied without being forced.
Ready to Get Your Pie Chart Scored by an Expert?
Get personalised feedback on your Task 1 essays from Ed — an IELTS expert who has helped hundreds of students reach Band 7 and above. Your band score is not fixed. Let's raise it together.
Start Your Journey at IELTSbyEd.com →Join hundreds of students who improved their band score with IELTSbyEd
